

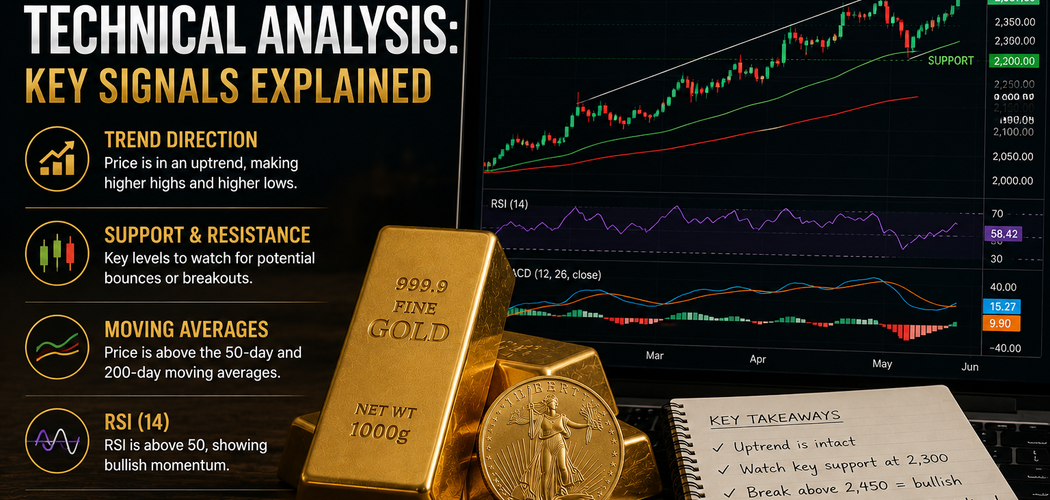
Gold prices respond to interest rates, currencies, inflation expectations, central bank activity, geopolitical events, and investor demand. However, traders also study the price chart itself. Gold price technical analysis uses historical market behavior to identify trends, important price zones, momentum, and possible changes in direction.
Technical analysis does not predict the future with certainty. Instead, it provides a framework for studying how buyers and sellers have behaved around particular prices.
Support and resistance are central concepts. Traders also use trend lines, moving averages, momentum indicators, and chart patterns. CME Group describes support as an area where falling prices may slow or reverse, while resistance can limit an advance. These areas can form around previous highs and lows, moving averages, trend lines, and important price levels.
The strongest approach does not depend on one indicator. Instead, traders can combine several signals and consider gold’s fundamental environment before making decisions.
What Is Technical Analysis?
Technical analysis studies historical price behavior.
Rather than estimating gold’s value from mining costs or economic conditions alone, a technical trader looks at what the market itself is doing.
Charts can reveal whether prices are trending higher, trending lower, or moving sideways. Indicators can then provide additional information about momentum and volatility.
Fidelity explains that technical analysis uses charts, patterns, price data, and indicators to identify trends and market behavior. Common tools include moving averages, Relative Strength Index, MACD, and support and resistance.
For gold price technical analysis, traders can apply these tools to spot gold, futures, exchange-traded products, or other instruments linked to the metal.
However, the exact chart matters.
A five-minute chart can produce very different signals from a daily or weekly chart. Therefore, traders should select a timeframe that matches their objectives.
A long-term investor may care more about weekly trends. Meanwhile, a short-term trader may focus on hourly or daily movements.
Understanding Support in Gold Markets
Support is an area below the current market price where buying interest may become stronger.
Imagine gold repeatedly falls toward a certain zone and then rebounds.
Traders may begin viewing that area as support because buyers have previously entered there.
Previous lows frequently create these zones. Moving averages and trend lines can also act as support.
However, support should generally be treated as an area rather than an exact number.
CME Group specifically notes that support and resistance do not always hold precisely. Instead, traders often treat them as zones where price behavior may change.
This distinction matters in gold price technical analysis because temporary moves below support can occur without creating a lasting breakdown.
Traders often look for confirmation before deciding that support has truly failed.
What Happens When Support Breaks?
A decisive break below support can indicate increasing selling pressure.
However, the former support level can remain important.
When prices later recover toward that area, sellers may enter. As a result, previous support can become resistance.
CME Group identifies this role reversal as a common technical behavior: broken support can become resistance, while broken resistance can later become support.
Traders sometimes call the return toward the broken level a retest.
If gold fails to reclaim that zone, the breakdown may appear stronger.
Understanding Resistance
Resistance works in the opposite direction.
It is an area above the market where selling pressure may become strong enough to slow or reverse an advance.
Previous highs often create resistance.
Suppose gold reaches the same general price area several times but repeatedly fails to move higher. Traders may begin watching that zone closely.
Some existing holders may take profits there. Meanwhile, short-term traders may expect another rejection.
However, resistance does not create an invisible ceiling.
If buying pressure becomes strong enough, gold can break above the level.
A convincing breakout may encourage additional buying as traders adjust their expectations.
Therefore, gold price technical analysis focuses not only on identifying resistance but also on observing what happens when gold reaches it.
Does the market immediately reverse? Does it consolidate? Or does it break higher with strong momentum?
Price behavior provides additional information.
How to Identify a Gold Price Trend
Trend identification is one of the simplest forms of technical analysis.
An uptrend generally develops when the market creates higher highs and higher lows.
A downtrend usually contains lower highs and lower lows.
Sideways markets lack a clear sequence in either direction.
Identifying the trend helps traders avoid analyzing individual price moves without context.
For example, a small decline during a strong uptrend may simply represent a pullback. The same decline during an established downtrend could represent continued weakness.
CME’s technical analysis education emphasizes that trends rarely move in perfectly straight lines. Profit-taking, news, and changes in economic conditions can create temporary moves against the dominant direction.
Therefore, traders should distinguish between normal corrections and genuine trend reversals.
Trend Lines Can Clarify Direction
Trend lines provide a visual way to monitor market structure.
During an uptrend, a trader can connect a series of important lows. Extending that line forward creates a potential support area.
During a downtrend, traders can connect important highs to create descending resistance.
Trend lines can also form channels.
For example, an upward channel may contain a rising support line beneath price and another line connecting important highs.
As long as gold remains within that structure, traders may consider the trend intact.
A break outside the channel can provide an early warning that conditions are changing.
However, drawing trend lines involves judgment.
Different traders may choose slightly different points. Therefore, they should not be treated as perfectly objective signals.
Combining them with other tools can improve gold price technical analysis.
Moving Averages Help Filter Market Noise
Gold can experience substantial daily fluctuations.
Moving averages smooth those fluctuations and make the broader direction easier to see.
A simple moving average calculates the average price over a selected number of periods. An exponential moving average gives greater weight to more recent observations.
Common periods include 20, 50, 100, and 200 days, although traders can choose many others.
CME notes that moving averages can act as dynamic support or resistance. Longer averages may represent more significant longer-term areas than very short averages.
Suppose gold trades consistently above a rising 200-day moving average.
Long-term traders may interpret that structure as constructive.
Conversely, sustained trading below a declining 200-day average could indicate a weaker long-term trend.
Still, moving averages are lagging indicators. They react to price rather than predict it.
Understanding Moving Average Crossovers
Traders sometimes compare two moving averages.
A widely followed example involves the 50-day and 200-day averages.
When the shorter average crosses above the longer average, traders sometimes call the event a golden cross.
When the shorter average moves below the longer one, it is often called a death cross.
These signals can indicate changing momentum.
However, they should not be interpreted as guaranteed turning points.
Because moving averages use historical data, a large portion of the price move may have occurred before the crossover appears.
Sideways markets can also create repeated false signals.
Fidelity notes that longer moving averages smooth more market noise, while shorter averages respond more quickly to recent price action.
Therefore, gold price technical analysis should consider crossovers within the broader trend rather than trading them automatically.
RSI Measures Gold Price Momentum
The Relative Strength Index, or RSI, is a widely used momentum indicator.
It moves between zero and 100.
Traditionally, readings above 70 are considered overbought, while readings below 30 are considered oversold.
However, these labels can be misunderstood.
An overbought reading does not mean gold must immediately fall. During a powerful uptrend, RSI can remain elevated for an extended period.
Likewise, oversold conditions do not guarantee an immediate rebound.
Instead, RSI helps traders evaluate the strength and speed of recent price movements.
Suppose gold reaches a new high while RSI fails to make a corresponding high. Traders may interpret that divergence as evidence that momentum is weakening.
Still, divergence alone does not confirm a reversal.
Price action should provide additional evidence.
MACD Can Help Confirm Trends
Moving Average Convergence Divergence, better known as MACD, is another popular momentum tool.
The indicator compares shorter-term and longer-term moving averages.
When shorter-term momentum strengthens relative to the longer-term trend, MACD can produce a bullish signal.
The opposite can indicate weakening momentum.
Fidelity describes MACD as a tool commonly used to evaluate momentum changes, trend direction, and potential entry or exit signals.
For gold traders, MACD can help confirm what the price chart already suggests.
For example, a breakout above resistance accompanied by improving MACD momentum may appear stronger than a breakout occurring while momentum weakens.
However, MACD also lags.
Therefore, it works better as one confirmation tool rather than a standalone prediction system.
Chart Patterns Can Signal Changing Conditions
Gold charts sometimes form recognizable structures.
Common continuation patterns include triangles, flags, and consolidations.
Reversal patterns can include double tops, double bottoms, and head-and-shoulders formations.
Technical traders watch these structures because they show how buying and selling pressure develops.
For example, a double top can occur when gold reaches a similar high twice but fails to break through.
A double bottom represents the opposite structure.
However, traders should wait for confirmation rather than assuming every similar-looking formation will become a reversal.
CME explains that analysts watch price behavior around tops and bottoms to evaluate whether an existing trend may be reversing or simply retracing before continuing.
Patterns are clues, not guarantees.
Breakouts Can Reveal Stronger Price Moves
A breakout occurs when gold moves beyond an established support or resistance area.
Suppose resistance has repeatedly stopped gold from advancing.
If prices finally move decisively above that zone, traders may interpret the move as evidence that buying pressure has overcome available selling.
However, not every breakout succeeds.
Gold may briefly move above resistance before falling back below it. Traders often call this a false breakout.
Therefore, gold price technical analysis often seeks confirmation.
A trader might look for a daily close beyond resistance, sustained trading above the level, stronger momentum, or a successful retest.
The appropriate confirmation depends on the trader’s timeframe.
Waiting for additional evidence can reduce false signals. However, it may also mean entering after part of the move has already occurred.
Technical analysis always involves trade-offs.
Multiple Signals Can Create Stronger Evidence
No technical indicator works perfectly.
Support can break. Moving average crossovers can fail. RSI can remain overbought, while chart patterns can produce false breakouts.
Therefore, many traders look for confluence.
Confluence occurs when several independent signals point toward a similar conclusion.
Suppose gold reaches a previous support zone. A rising 200-day moving average sits nearby, while RSI approaches oversold territory.
Those three observations may create stronger evidence than any single indicator.
Likewise, a resistance breakout accompanied by improving momentum and a successful retest can appear more convincing.
CME’s technical education recommends using individual techniques as pieces of evidence rather than relying on them in isolation.
For gold price technical analysis, combining signals can create a more structured decision-making process.
Different Timeframes Can Show Different Trends
A common source of confusion occurs when different charts tell different stories.
Gold might be rising on a weekly chart while falling on a one-hour chart.
Both observations can be correct.
The hourly decline may simply represent a short-term correction within a larger bullish trend.
Therefore, traders should define their timeframe before interpreting signals.
Long-term investors may start with monthly and weekly charts. Swing traders may focus more heavily on daily and four-hour charts.
Short-term traders can examine hourly or intraday charts.
A useful approach is to begin with the larger timeframe.
First, determine the dominant trend. Then move to a shorter timeframe to identify potential support, resistance, and entry areas.
This process prevents short-term volatility from obscuring the larger market structure.
Fundamentals Can Override Technical Signals
Gold does not trade in a vacuum.
An unexpected central bank decision, geopolitical event, inflation report, or financial crisis can quickly push prices through technical levels.
CME notes that external events can move markets outside previously established support and resistance zones.
This is particularly important for gold because macroeconomic conditions strongly influence investment demand.
Suppose technical indicators suggest resistance above the current price.
Then a major monetary policy surprise causes investors to purchase gold aggressively.
The market could move through that resistance before traders have time to react.
Therefore, technical analysis should complement fundamental analysis.
Charts show how market participants are behaving. Fundamentals can help explain why that behavior might change.
Risk Management Matters More Than Any Signal
Even an excellent technical setup can fail.
Therefore, traders need a plan for what happens when the market moves against them.
Position size is one important consideration.
A trader should avoid risking an excessive portion of capital on one forecast.
Stop-loss orders can also be used to define risk, although they cannot guarantee a particular execution price during fast markets.
Traders can also establish profit targets near potential resistance or support areas.
Most importantly, decisions should be made before emotions become intense.
Gold can move rapidly after economic announcements or geopolitical events.
A written plan reduces the temptation to make impulsive decisions after prices have already moved.
Successful gold price technical analysis is therefore not only about finding entries. It also requires managing uncertainty when an analysis proves wrong.
Common Technical Analysis Mistakes
One common mistake is using too many indicators.
Adding numerous oscillators, moving averages, and chart tools can make the analysis confusing rather than useful.
Another mistake is treating support and resistance as exact numbers.
Markets frequently move slightly beyond important levels before reversing.
Traders may also assume that an overbought RSI guarantees a decline. Strong trends can remain overbought much longer than expected.
Ignoring the larger timeframe creates another problem.
A bearish signal on a very short chart may have little significance within a powerful long-term uptrend.
Finally, traders sometimes ignore fundamentals entirely.
Technical analysis provides useful information, but gold remains highly sensitive to macroeconomic events.
A balanced approach can reduce these mistakes.
A Simple Gold Chart Analysis Process
Beginners can simplify their analysis by following a consistent sequence.
Start with the long-term trend.
Examine a weekly or daily chart and determine whether gold is generally making higher highs and higher lows, lower highs and lower lows, or moving sideways.
Next, identify important support and resistance zones.
Look at previous highs, previous lows, moving averages, and major consolidation areas.
Then examine momentum.
RSI or MACD can help determine whether momentum supports the apparent trend.
After that, look for confluence.
A price zone supported by several technical observations may deserve more attention than an isolated indicator.
Finally, review fundamental conditions before making a decision.
This structured approach makes gold price technical analysis easier to repeat and evaluate.
Technical Analysis Should Focus on Probability
Technical analysis cannot tell investors exactly where gold will trade tomorrow.
Its value comes from organizing probabilities.
A support zone indicates an area where buyers may become more active. Resistance identifies a region where selling could increase.
Trend analysis shows the market’s current direction.
Momentum indicators provide information about the strength of that movement.
None of these tools eliminates uncertainty.
Instead, traders can use them to create scenarios.
If resistance breaks and holds, one scenario becomes more likely. If gold fails at resistance and momentum weakens, another scenario becomes more relevant.
Thinking in probabilities helps traders avoid becoming emotionally attached to one prediction.
Conclusion
Technical analysis provides investors and traders with a structured way to interpret gold price behavior.
Support identifies areas where buying may strengthen. Resistance highlights zones where selling may increase. Trend lines and moving averages help reveal market direction, while RSI and MACD provide information about momentum.
However, no single indicator can reliably predict every move.
Effective gold price technical analysis combines multiple forms of evidence. A support zone becomes more meaningful when a moving average, trend line, and momentum signal provide additional confirmation.
Timeframe also matters.
A short-term decline can occur inside a long-term uptrend. Therefore, traders should understand the larger market structure before focusing on smaller price movements.
Fundamental conditions remain equally important. Interest rates, currencies, inflation, central banks, and geopolitical developments can rapidly change gold’s direction.
Most importantly, technical analysis should support risk management rather than encourage certainty.
Markets can always behave differently from expectations.
By treating charts as tools for evaluating probability instead of predicting the future, investors can use gold price technical analysis to make more structured decisions while recognizing the risks that remain.
FAQ
1. What Are Support and Resistance in Gold Trading?
Support is an area where buying may slow or reverse a decline. Resistance is an area where selling may slow an advance. Traders often identify them using previous highs, lows, moving averages, and trend lines.
2. Which Moving Averages Are Commonly Used for Gold?
Traders often watch periods such as the 20-day, 50-day, 100-day, and 200-day averages. Longer averages generally provide more information about the broader trend, while shorter averages react faster.
3. What Does an RSI Above 70 Mean?
Traditionally, an RSI above 70 indicates overbought conditions. However, it does not guarantee an immediate decline. Strong trends can maintain elevated RSI readings for extended periods.
4. Can Technical Analysis Predict Gold Prices Accurately?
Technical tools cannot predict prices with certainty. They help traders identify trends, momentum, important price zones, and possible scenarios based on historical market behavior.
5. Should Gold Traders Use Technical or Fundamental Analysis?
Using both can provide broader context. Fundamentals help explain major economic drivers, while gold price technical analysis can identify trends, support, resistance, momentum, and potential timing signals.