

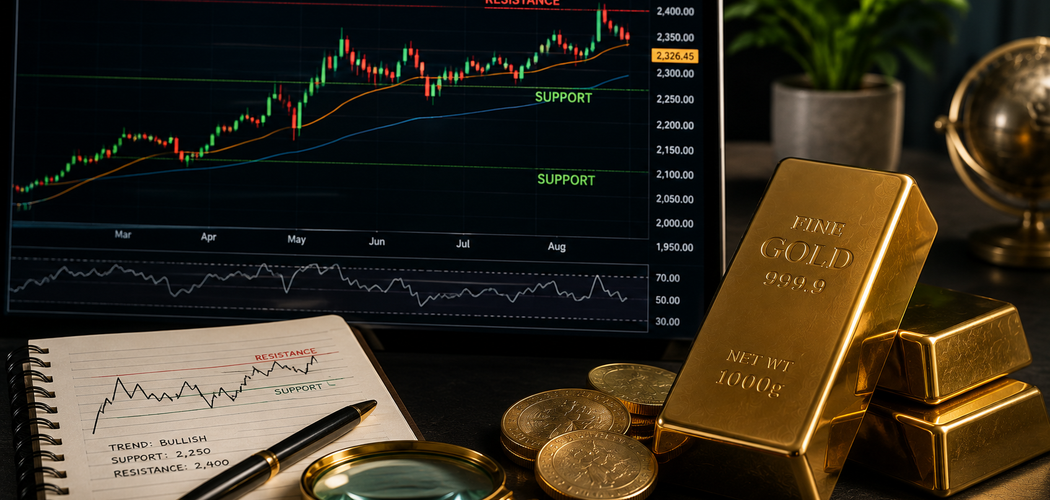
Gold prices can move quickly when interest rates, inflation expectations, currencies, geopolitical events, and investor sentiment change. However, fundamental information does not always tell investors when a price move may begin or end. Gold price technical analysis provides another way to study the market by examining price behavior, trends, momentum, and important chart levels.
Technical analysis focuses primarily on what the market is doing rather than what analysts believe it should do. Traders study historical and current prices to identify patterns that may provide clues about future behavior. Fidelity describes technical analysis as the study of charts, patterns, and indicators to understand market behavior and potentially improve trade timing and risk management.
No chart pattern guarantees a future result. Unexpected economic news can quickly invalidate even a strong technical setup.
Still, investors who understand trends, support, resistance, moving averages, momentum, and volume can develop a more structured approach to reading gold charts.
What Is Technical Analysis?
Technical analysis studies market price behavior.
Instead of calculating what gold should theoretically be worth, technical traders examine what buyers and sellers are actually doing.
A chart can reveal whether prices are rising, falling, or moving sideways. It can also highlight areas where buying or selling has repeatedly appeared.
Technical indicators add another layer of information.
Moving averages help smooth price fluctuations. Momentum indicators measure the strength of recent movements. Meanwhile, support and resistance identify areas where supply and demand have previously shifted.
The objective of gold price technical analysis is not to predict the future with certainty.
Instead, traders use charts to identify probabilities, manage risk, and recognize when market behavior changes.
That distinction is important. Technical analysis is a decision-making framework, not a crystal ball.
Start by Identifying the Trend
One of the first questions investors should ask is simple: What direction is gold moving?
Markets generally move in three broad ways.
An uptrend develops when prices create higher highs and higher lows.
A downtrend forms when prices produce lower highs and lower lows.
A sideways market occurs when gold repeatedly trades within a relatively stable range.
Identifying the trend helps investors understand the broader market structure.
For example, buying every small decline may work differently in a strong uptrend than in a sustained downtrend.
Likewise, breakout strategies can produce misleading signals when the market remains trapped inside a narrow range.
Therefore, investors should identify the dominant trend before studying individual indicators.
How to Recognize an Uptrend
An uptrend develops when buyers remain willing to purchase gold at progressively higher levels.
Suppose gold rises to a new high, pulls back, and then finds buyers above its previous major low.
Prices then rally to another higher high.
That pattern suggests upward momentum remains intact.
Traders often draw a trendline beneath important lows to visualize the structure.
However, trendlines should not be forced onto a chart.
A clean trend should be visible without requiring complicated interpretation.
With gold price technical analysis, investors can use trend structure alongside other indicators rather than relying on one line.
A temporary decline inside an established uptrend does not automatically mean the broader trend has ended.
How to Recognize a Downtrend
A downtrend shows the opposite behavior.
Prices create lower highs and lower lows.
Each rally fails before reaching the previous major high, while sellers continue pushing the market toward new lows.
A descending trendline can help visualize this structure.
Moving averages may also begin sloping downward.
Recent CME commentary provides a practical example of how traders use this framework. In May 2026, CME noted that gold had moved below its 50-day moving average and that the average was acting as an important congestion area during the downtrend.
The lesson is broader than one market period.
Traders should watch how price behaves around important technical levels instead of assuming every decline is automatically a buying opportunity.
Understanding Support Levels
Support is an area where buying interest has previously been strong enough to slow or stop a decline.
Imagine gold repeatedly falling toward a particular price zone before recovering.
Traders may begin treating that area as support.
Support exists because market participants remember previous price behavior.
Some investors may view the area as attractive. Others may have missed the previous rally and wait for another opportunity to buy.
Fidelity defines support as a price area where buying interest may become strong enough to prevent further declines.
However, support is better viewed as a zone rather than an exact number.
Gold can briefly move below a level before recovering.
Therefore, gold price technical analysis should avoid treating every small break as a confirmed trend change.
Understanding Resistance Levels
Resistance works in the opposite direction.
It represents an area where selling pressure has previously limited price increases.
Suppose gold rallies toward the same region several times but repeatedly reverses.
Traders may identify that region as resistance.
Some investors who purchased near the previous high may sell when prices return. Short-term traders may also take profits.
As a result, selling pressure can increase.
Resistance does not guarantee that gold will fall.
Instead, it highlights a price area where buyers may need greater momentum to continue the rally.
When gold breaks decisively above important resistance, the move can attract additional attention because the previous barrier has been removed.
Support Can Become Resistance
One useful chart principle is that broken support can sometimes become resistance.
Suppose gold repeatedly holds above a major level.
Eventually, sellers push prices below it.
If gold later rallies back toward that same area, traders who bought near the old support may use the recovery to exit.
Selling pressure can therefore appear near the former support zone.
The reverse can also occur.
Resistance that is convincingly broken may later act as support.
This behavior is often called a role reversal.
It gives gold price technical analysis a useful framework for identifying areas worth monitoring after breakouts and breakdowns.
Still, investors should seek confirmation because markets frequently produce false breaks.
Moving Averages Make Trends Easier to See
Daily gold prices contain considerable noise.
Moving averages smooth that data and make the broader direction easier to identify.
A 50-day moving average reflects shorter-term behavior more closely than a 200-day average.
Meanwhile, the longer average provides a slower view of the broader trend.
Fidelity notes that longer moving averages can help assess long-term trends, while shorter averages follow recent price movements more closely. Moving averages can also behave as potential support or resistance.
For gold investors, watching the relationship between price and major averages can provide useful context.
However, moving averages lag because they are calculated from historical prices.
They confirm trends rather than predict exact turning points.
The 50-Day and 200-Day Moving Averages
Two commonly followed averages are the 50-day and 200-day moving averages.
When gold remains above a rising 200-day average, traders may interpret the long-term structure as constructive.
A price below a falling 200-day average may suggest weaker conditions.
The 50-day average reacts more quickly.
Therefore, it can help investors identify medium-term momentum changes.
Some traders also watch when the two averages cross.
A shorter average moving above a longer average may indicate improving momentum. Conversely, a downward crossover can suggest weakening conditions.
However, gold price technical analysis should not rely on moving-average crossovers alone.
Sideways markets can create repeated false signals because prices move back and forth without establishing a sustainable trend.
Use RSI to Measure Momentum
The Relative Strength Index, or RSI, is a popular momentum indicator.
It ranges from zero to 100 and compares the strength of recent gains with recent losses.
Traditionally, readings above 70 are considered overbought, while readings below 30 are considered oversold.
However, these labels can be misleading when taken too literally.
Overbought does not mean gold must immediately decline.
A powerful uptrend can keep RSI elevated for an extended period.
Likewise, oversold conditions do not guarantee an immediate rally.
Therefore, RSI works best as context.
For example, an oversold reading near established support may deserve more attention than the same reading during a powerful breakdown.
Watch for RSI Divergence
Divergence occurs when price and momentum move differently.
Suppose gold reaches a new high while RSI creates a lower high.
Momentum is weakening even though price continues rising.
That can warn that the rally is losing strength.
The opposite can occur during declines.
Gold may reach a lower low while RSI creates a higher low.
This bullish divergence can suggest selling momentum is weakening.
However, divergence is not a guaranteed reversal signal. Fidelity notes that RSI divergence can provide reversal clues, but strong trends can maintain unusual momentum readings for extended periods.
MACD Helps Identify Momentum Changes
Moving Average Convergence/Divergence, commonly called MACD, is another widely used momentum indicator.
MACD compares shorter and longer exponential moving averages.
Traders typically watch the MACD line, signal line, and zero level.
When the MACD line crosses above its signal line, momentum may be improving.
A downward crossover can suggest weakening momentum.
Fidelity explains that MACD is primarily a trend-following momentum oscillator and warns that it can generate repeated whipsaws during trading ranges.
Therefore, gold price technical analysis becomes stronger when MACD confirms an existing trend instead of being used alone.
A bullish crossover near important support may carry more context than one occurring randomly inside a sideways range.
Breakouts Can Signal a New Market Phase
A breakout occurs when gold moves above an important resistance area.
Suppose prices remain below a major level for several months.
Eventually, strong buying pushes gold decisively above it.
That move may indicate the balance between buyers and sellers has changed.
Traders often look for confirmation before trusting the breakout.
A strong close above resistance can help.
Follow-through during subsequent sessions can provide additional evidence.
If the market quickly falls back below the breakout level, the move may have been false.
Therefore, investors should avoid buying automatically simply because gold trades slightly above resistance for a short period.
Breakdowns Are Equally Important
A breakdown occurs when price falls below established support.
This can indicate that buyers who previously defended the level are no longer strong enough.
Selling may accelerate if traders use stop-loss orders below support.
However, false breakdowns also occur.
Gold can temporarily move below support and then recover quickly.
Therefore, traders may look for a decisive close below the level and continued weakness afterward.
Combining gold price technical analysis with fundamental context can also help.
For example, a breakdown accompanied by rising real yields and a stronger dollar may appear more convincing than an isolated intraday move.
Chart Patterns Can Organize Price Behavior
Technical traders use chart patterns to organize recurring market structures.
Common examples include triangles, rectangles, double tops, double bottoms, and head-and-shoulders formations.
A double top forms when price tests a major high twice but fails to break through.
A double bottom reflects repeated support near a major low.
Triangles develop when the trading range becomes progressively narrower.
However, patterns should not be treated as guarantees.
The important information is how buyers and sellers behave near the boundaries.
A pattern becomes more meaningful when price confirms it through a breakout or breakdown.
Therefore, traders should wait for evidence rather than predict the direction simply because a familiar shape appears.
Time Frames Can Change the Story
A gold chart can look bullish on one time frame and bearish on another.
For example, the daily chart might show a short-term correction.
Meanwhile, the weekly chart could remain in a strong long-term uptrend.
Neither view is necessarily wrong.
They answer different questions.
Short-term traders may focus on hourly and daily charts.
Long-term investors may find weekly and monthly charts more useful.
A practical gold price technical analysis process starts with the longer time frame before moving to shorter charts.
This provides context.
An apparent breakdown on an hourly chart may be little more than ordinary volatility within a much larger bullish trend.
Do Not Use Too Many Indicators
Modern charting platforms provide hundreds of indicators.
Using more indicators does not automatically produce better analysis.
In fact, excessive indicators can create confusion.
Several tools may measure similar information while producing slightly different signals.
A simpler approach can be more effective.
Investors might begin with price structure, support and resistance, one or two moving averages, RSI, and MACD.
Each tool should have a purpose.
Price structure identifies the trend.
Support and resistance reveal important zones.
Moving averages smooth price behavior.
RSI measures momentum, while MACD can help confirm trend changes.
The objective is confirmation, not collecting as many indicators as possible.
Combine Technical and Fundamental Analysis
Technical and fundamental analysis do not need to compete.
They answer different questions.
Fundamental analysis can help investors understand why gold may rise or fall.
Interest rates, inflation, central bank purchases, currencies, investment flows, and geopolitical risk all influence the market.
Technical analysis can help identify how those expectations appear in price behavior.
For example, an investor may have a bullish long-term gold outlook because real yields are declining.
However, gold may still be trading below major resistance.
Waiting for stronger technical confirmation can provide additional information.
Likewise, a bullish chart should not cause investors to ignore major changes in monetary conditions.
Combining both approaches can create a more complete framework.
Risk Management Matters More Than Prediction
Even excellent analysis can fail.
A surprise inflation report can change rate expectations within minutes.
Central banks can alter policy guidance, while geopolitical developments can produce sudden volatility.
Therefore, investors should decide how much they are willing to risk before entering a position.
Technical levels can help with this process.
A trader buying near support may decide that a confirmed breakdown invalidates the original idea.
Position size also matters.
No single gold trade should create unacceptable financial damage if the analysis proves wrong.
Ultimately, gold price technical analysis should support risk management rather than encourage investors to believe they can predict every market move.
Common Technical Analysis Mistakes
One common mistake is forcing patterns onto charts.
Another is treating support and resistance as exact prices rather than zones.
Investors also misuse RSI by automatically selling whenever it exceeds 70 or buying whenever it falls below 30.
Strong trends can remain overbought or oversold for longer than expected.
Moving averages create another problem.
Because they lag, investors may enter after a substantial move has already occurred.
Using too many indicators can also produce contradictory signals.
Finally, some traders ignore fundamental events completely.
A technically attractive setup can fail when unexpected economic news changes the market environment.
The best approach accepts that every indicator has limitations.
Build a Simple Gold Chart Routine
Beginners can create a repeatable process.
First, open a weekly chart and identify the long-term trend.
Next, examine the daily chart.
Mark major highs and lows to identify support and resistance.
Add a 50-day and 200-day moving average.
Then examine RSI and MACD for momentum confirmation.
Ask whether these indicators support or contradict the price structure.
Afterward, check major fundamental factors such as real yields, the dollar, central bank expectations, and geopolitical conditions.
Finally, decide what evidence would prove the analysis wrong.
This last step is essential.
A useful trading plan defines both the opportunity and the risk before money is committed.
Focus on Confirmation, Not Certainty
Technical analysis works with probabilities.
Suppose gold breaks above resistance.
That is one bullish signal.
If the breakout occurs while the price remains above rising moving averages and momentum improves, several indicators now support the same interpretation.
The setup may become more convincing.
However, it is still not certain.
Unexpected information can reverse the market.
This is why experienced traders frequently look for confirmation from multiple independent signals.
Good gold price technical analysis does not eliminate uncertainty.
Instead, it creates a disciplined way to respond to uncertainty.
That mindset can help investors avoid emotional decisions based on headlines, fear, or excitement.
Conclusion
Gold charts contain valuable information about how buyers and sellers are behaving.
Investors can use trends to identify the market’s broader direction, while support and resistance reveal important price zones.
Moving averages can make trends easier to see.
Meanwhile, RSI and MACD provide information about momentum and potential changes in market strength. Fidelity notes that these tools can help investors study trends, momentum, volatility, and market behavior, although no technical indicator guarantees future performance.
Breakouts and breakdowns can signal important changes, but false moves remain common.
Therefore, investors should seek confirmation rather than relying on a single indicator.
Fundamental analysis also remains valuable because interest rates, currencies, inflation, central banks, and geopolitical events can quickly reshape gold’s outlook.
Ultimately, gold price technical analysis works best as part of a broader decision-making process.
Investors who combine price structure, momentum, fundamentals, and disciplined risk management can develop a clearer framework for interpreting the gold market without pretending that any chart can predict the future with certainty.
FAQ
1. What Is the Best Technical Indicator for Gold?
There is no single best indicator. Moving averages, RSI, MACD, support, resistance, and price trends provide different information. Using several complementary tools can create stronger context.
2. What Does Support Mean on a Gold Chart?
Support is an area where buying has previously become strong enough to slow or reverse a decline. However, support can fail, so traders often seek confirmation.
3. How Do I Identify Resistance in Gold?
Look for price areas where previous rallies repeatedly stopped or reversed. These zones can indicate where selling pressure has historically increased.
4. Is RSI Reliable for Gold Trading?
RSI can provide useful momentum information, but it should not be used alone. Overbought and oversold readings can persist during strong trends.
5. Can Technical Analysis Predict Gold Prices?
No method can predict prices consistently with certainty. Gold price technical analysis helps traders identify trends, momentum, support, resistance, and potential scenarios so they can make more structured decisions.